Inzonex Carbon Hubpowered by inzonex.co.uk
Carbon HubIndustries → Textiles & dyeing
Decarbonization · Textiles & dyeing

Decarbonizing textiles & dyeing: the honest pathway

Wet processing — dyeing, washing, drying at 60–180 °C — is where textile carbon lives. The sector's stenter frames and dye jigs are notorious heat wasters, and most capacity sits in countries with no carbon price but heavy brand Scope-3 pressure.

Cost exposure

What one t fabric carries, 2026 → 2034

YearFree allocation (EU)Payable carbon costAnnual bill (per 100,000 t fabric)
202697.5%€0.80 / t fabric€80,010
203051.5%€15.52 / t fabric€1,552,194
20340.0%€32.00 / t fabric€3,200,400

At EUA €80.01 (July 13, 2026) and ≈0.3–0.5 t CO2/t fabric (wet processing; dyeing-dominant). EU ETS industry schedule; exporters under CBAM follow the mirrored phase-in. Power sectors pay 100% from day one.

The pathway, ranked

Reduction measures for textiles & dyeing

Heat recovery on dyehouse effluent & stenter exhaust−20%
Heat pumps for low-temp dyeing/washing−30%
Steam & condensate system incl. insulation−6%
Low-liquor-ratio dyeing machines−25%
Solar thermal pre-heat−15%

Indicative reduction potential of each measure against the relevant emissions share (sources: IEA industry roadmaps, sector associations — see each measure page). Measures stack but don't simply add.

The fast tonnes

Heat losses you can cut this budget year

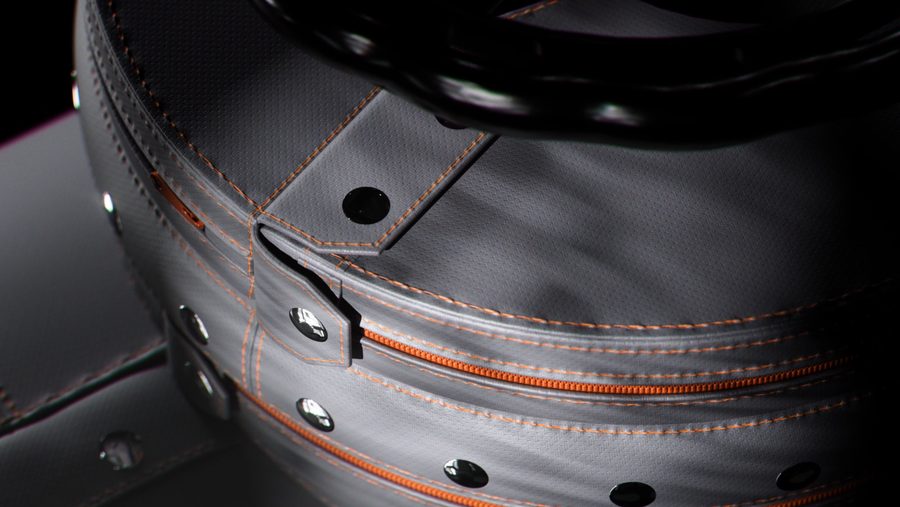
Brand Scope-3 programmes (H&M, Inditex cascades) now demand supplier kg-CO2/kg-fabric — making efficiency a commercial qualification, not a cost line. Steam-side losses are the first thing an auditor sees; removable insulation gives the photo they want plus the savings you keep.

Method: ASTM C680 / ISO 12241 surface energy balance — the same engine as our public calculators. Typical removable-insulation effect across hot-process plants: 2–5% of fuel-related CO2, payback up to 2 years.

Context

How textiles & dyeing compares (t CO2 per unit)

Hydrogen production9 t/t H2
Ammonia & fertilizers2 t/t NH3
Steel — BF-BOF (integrated)1.9 t/t steel
Aluminium1.6 t/t Al
Lime1.2 t/t lime
Petrochemicals1 t/t HVC
Power — coal0.95 t/MWh
Textiles & dyeing0.4 t/t fabric

Direct-emission intensities, typical published values per industry page — units differ by product; see each page for sources.

FAQ

Textiles & dyeing & carbon, answered

Why do clothing brands audit factory emissions?
CSRD/ISSB Scope-3 reporting flows down the chain: your stenter's gas use becomes their disclosed footprint — supplier scorecards now carry kg CO2/kg fabric.
Where does a dyehouse lose energy?
Hot effluent down the drain, stenter exhaust to roof, bare steam lines. Effluent heat exchangers + insulation typically cut 15–25% of thermal demand.
Do textile plants pay carbon prices?
Mostly not yet (Bangladesh/Vietnam/Türkiye*) — but Türkiye's new ETS and brand pressure are converging on the same outcome: measured, lower energy per kg.
How this page is built: heat-loss figures follow ASTM C680 / ISO 12241 (the method behind our public calculators); facility emissions from Climate TRACE & EU ETS verified data across 30,000+ industrial sites; the 2026–2034 schedule is Regulation (EU) 2023/956, not a forecast. Published by Inzonex Research. Spotted an error? Tell us — we correct on evidence.
Source: Inzonex Carbon Hub — inzonex.co.uk/carbon · prices dated as shown on each figure · schedule per Regulation (EU) 2023/956 · indicative analytics, not compliance advice.