
Industrial laundry
Use boiler load or measured steam. Example below uses 5 t/h steam for 6,000 h/year.
30,000 tsteam/year
€2,024,547.0Germany example
Good inputt steam/h
Laundry heat-loss calculator →
The cost of one tonne of industrial steam across 33 European country rows, computed from official gas prices and the carbon price.
Sweden tops the current index at €94.6/t incl. CO₂; Georgia is lowest at €32.7/t. This is a reproducible calculation, not a survey.
Country averages give a benchmark; the calculator below adapts the same method to site assumptions.
| Country | Gas €/MWh | Steam fuel €/t | Steam incl. CO₂ €/t | 1 kW loss €/yr | Data status |
|---|---|---|---|---|---|
| Sweden | €106.5 | €82.2 | €94.6 | €726 | official 2025-S2 |
| Liechtenstein | €93.0 | €71.8 | €84.2 | €634 | official 2025-S2 |
| Finland | €86.3 | €66.6 | €79.1 | €588 | official 2025-S2 |
| Germany | €71.3 | €55.0 | €67.5 | €486 | official 2025-S2 |
| Netherlands | €67.4 | €52.0 | €64.5 | €460 | official 2025-S2 |
| Ireland | €66.7 | €51.5 | €63.9 | €455 | official 2025-S2 |
| Luxembourg | €65.7 | €50.7 | €63.2 | €448 | official 2025-S2 |
| Poland | €64.7 | €49.9 | €62.4 | €441 | official 2025-S2 |
| Moldova | €64.2 | €49.5 | €62.0 | €438 | official 2025-S2 |
| Austria | €64.1 | €49.5 | €61.9 | €437 | official 2025-S2 |
| Slovakia | €64.0 | €49.4 | €61.9 | €436 | official 2025-S2 |
| Denmark | €63.2 | €48.8 | €61.2 | €431 | official 2025-S2 |
| France | €62.9 | €48.5 | €61.0 | €429 | official 2025-S2 |
| EU-27 average | €60.5 | €46.7 | €59.2 | €412 | official 2025-S2 |
| Slovenia | €57.7 | €44.5 | €57.0 | €393 | official 2025-S2 |
| Czechia | €56.8 | €43.8 | €56.3 | €387 | official 2025-S2 |
| Estonia | €56.7 | €43.7 | €56.2 | €387 | official 2025-S2 |
| Bosnia and Herzegovina | €53.2 | €41.0 | €53.5 | €363 | official 2025-S2 |
| Latvia | €52.8 | €40.7 | €53.2 | €360 | official 2025-S2 |
| Hungary | €51.8 | €40.0 | €52.4 | €353 | official 2025-S2 |
| Romania | €51.4 | €39.7 | €52.1 | €350 | official 2025-S2 |
| Italy | €51.3 | €39.6 | €52.1 | €350 | official 2025-S2 |
| Spain | €50.8 | €39.2 | €51.7 | €346 | official 2025-S2 |
| Lithuania | €50.8 | €39.2 | €51.7 | €346 | official 2025-S2 |
| Serbia2024-S2 | €50.8 | €39.2 | €51.7 | €346 | latest available (2024-S2) |
| Croatia | €48.6 | €37.5 | €50.0 | €331 | official 2025-S2 |
| Belgium | €48.1 | €37.1 | €49.6 | €328 | official 2025-S2 |
| Portugal | €48.1 | €37.1 | €49.6 | €328 | official 2025-S2 |
| North Macedonia | €46.0 | €35.5 | €48.0 | €314 | official 2025-S2 |
| Greece | €42.4 | €32.7 | €45.2 | €289 | official 2025-S2 |
| Bulgaria | €41.4 | €31.9 | €44.4 | €282 | official 2025-S2 |
| Türkiye | €30.1 | €23.2 | €35.7 | €205 | official 2025-S2 |
| Georgia | €26.2 | €20.2 | €32.7 | €179 | official 2025-S2 |
The CO₂ column tracks the live EUA where available, otherwise the dated build value. The CSV mirrors the visible index.
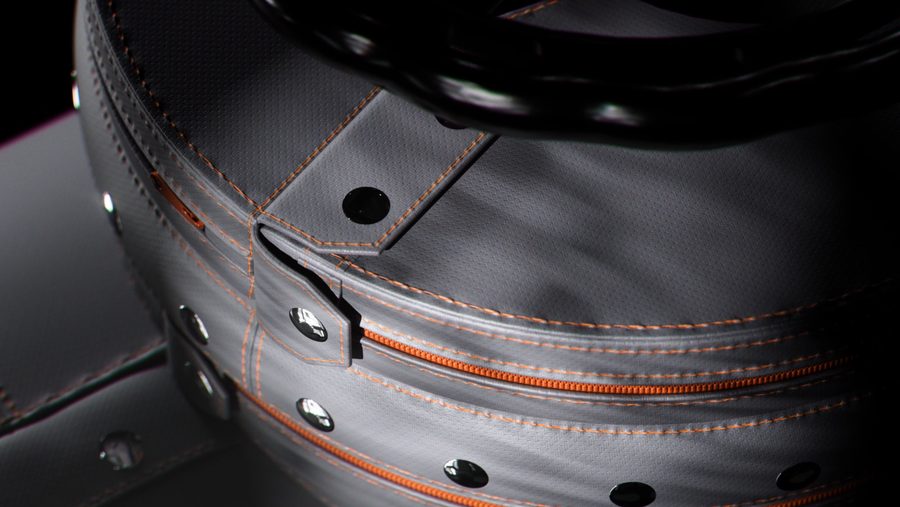
Boilers, kilns, heat exchangers, valves and steam lines lose energy continuously. Inzonex makes Inzonex Modular Insulation — snap-fastened modules engineered per temperature tier, not generic off-the-shelf jackets:
Every tonne you stop emitting is a tonne you don't have to report: cutting heat loss is a measurable, auditable Scope 1 reduction that flows straight into EU ETS, CBAM and your ESG / CSRD disclosures — not an offset, an actual emission cut.
Turn the public benchmark into a plant estimate by changing the assumptions engineers already know.
Change gas price, efficiency, hours, steam load and standing heat loss.
Fuel €/t steam = (0.679 MWh/t ÷ η) × gas €/MWh

CO₂ €/t steam = (0.679 MWh/t ÷ η) × 0.202 tCO₂/MWh × EUA €/tCO₂

Annual steam cost = (fuel + CO₂) × steam t/h × hours/year

Heat-loss cost = heat-loss kW × hours/year × gas €/MWh ÷ η ÷ 1000
Start from the way a plant thinks about steam: tonnes of linen, brewhouse load, boiler output or operating hours.
Use boiler load or measured steam. Example below uses 5 t/h steam for 6,000 h/year.
Use brewhouse steam demand, packaging load or measured boiler output; avoid generic hL assumptions unless a site provides them.
Works for bakery, dairy, meat and beverage plants when boiler capacity and operating hours are known.
The source chain stays visible, so users can trace each number back to gas price, carbon price and steam assumptions.
Use this index to see where a tonne of steam — and each kilowatt of standing heat loss — costs most across Europe, then estimate the impact of reducing losses on boilers, steam lines, valves and hot equipment using your own site assumptions.