Inzonex Carbon Hubpowered by inzonex.co.uk
Carbon HubCountry × industry → Peru · Cement
Data layer · est. 2023

Cement in Peru: emitters, CO2 & carbon value

7 tracked facilities, ≈5,583,338 t CO2/yr combined — here are the largest, what that CO2 is worth at current prices, and the sector's reduction pathway. Full sector pathway: decarbonizing cement.

The numbers

Cement in Peru at a glance

MetricValueNote
Facilities tracked7with CO2 estimates
Total est. CO25,583,338 t/yrClimate TRACE 2023
Average per facility797,620 t/yr
Gross value (full price)€421M/yrall tracked CO2 × €75.36/t CBAM ref — before free allocation / EU-bound share
📦 Cement is a CBAM sector. EU-bound exports from Peru pay the border price on the 2026→2034 phase-in — how CBAM works.

No carbon-pricing instrument is tracked for this country on this hub — exporters of CBAM goods to the EU still pay the border price with no domestic deduction.

Largest emitters

Top 7 cement CO2 emitters in Peru

#FacilityOwnert CO2/yr (est. 2023)Indicative value
1Atocongo Cement PlantUnacem Perú SA1,823,284€137.4M
2Yura Cement PlantYura SA1,163,130€87.7M
3Pacasamayo Cement PlantCementos Pacasmayo SAA1,079,719€81.4M
4Condorocha Cement PlantUnacem Perú SA746,867€56.3M
5Piura Cement PlantCementos Pacasmayo SAA527,792€39.8M
6Rioja Cement PlantCementos Pacasmayo SAA143,940€10.8M
7Cajamarquilla Cement PlantCaliza Cementos Inca SA98,606€7.4M

Climate TRACE satellite estimates via IndustryAtlas — modelled, not verified; some entries aggregate clusters. Corrections welcome.
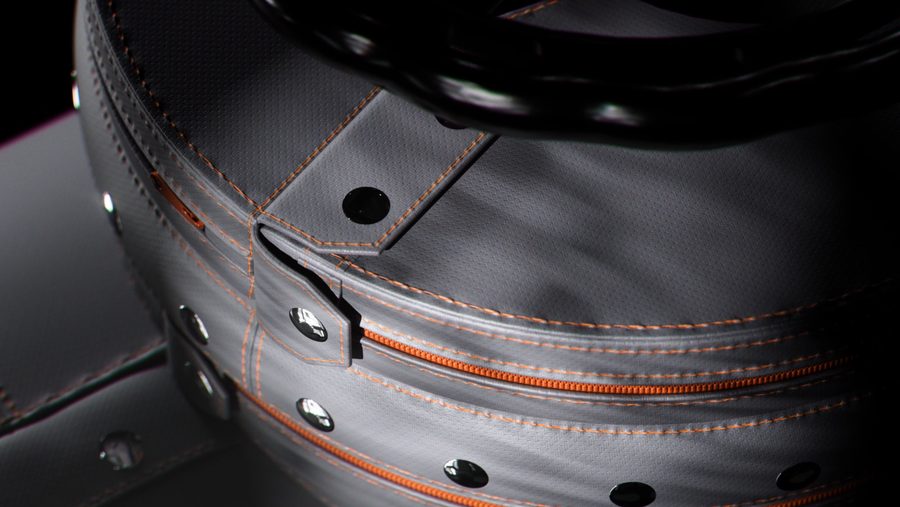
Inzonex removable modular insulation on industrial equipment
Cut the tonnes at the source

Hot industrial equipment? Cut the heat loss.

Boilers, kilns, heat exchangers, valves and steam lines lose energy continuously. Inzonex makes Inzonex Modular Insulation — snap-fastened modules engineered per temperature tier, not generic off-the-shelf jackets:

  • Up to 96% less heat loss from insulated surfaces
  • Surface temperature ≤45 °C — touch-safe for workers (EN ISO 13732-1)
  • 6× faster maintenance access vs standard insulation jackets and metal cladding/boxes — unclips and refits in minutes, no destruction
  • Inspectable — opens for corrosion-under-insulation checks, then refits like-new (generic jackets often don't survive removal)
  • Typical payback under 2 years — some sites 9–11 months

Every tonne you stop emitting is a tonne you don't have to report: cutting heat loss is a measurable, auditable Scope 1 reduction that flows straight into EU ETS, CBAM and your ESG / CSRD disclosures — not an offset, an actual emission cut.

Same industry, other countries
Other industries in Peru
FAQ

Questions

How many cement facilities does Peru have with tracked emissions?
7 facilities carry satellite-based CO2 estimates in our dataset (Climate TRACE 2023), totalling ≈5,583,338 t CO2/yr.
What is the largest cement emitter in Peru?
Atocongo Cement Plant — ≈1,823,284 t CO2/yr (est. 2023). Estimates are modelled, not verified declarations.
What would this CO2 cost at the CBAM price?
The gross full-price value is ≈€421M/yr (all tracked CO2 × €75.36/t CBAM ref). Actual CBAM liability is far smaller: it falls only on emissions embedded in EU-bound exports, and only on the phased-in share — 2.5% in 2026 rising to 100% by 2034 (Reg (EU) 2023/956).
How this page is built: heat-loss figures follow ASTM C680 / ISO 12241 (the method behind our public calculators); facility emissions from Climate TRACE & EU ETS verified data across 30,000+ industrial sites; the 2026–2034 schedule is Regulation (EU) 2023/956, not a forecast. Published by Inzonex Research. Spotted an error? Tell us — we correct on evidence.
Source: Inzonex Carbon Hub — inzonex.co.uk/carbon · prices dated as shown on each figure · schedule per Regulation (EU) 2023/956 · indicative analytics, not compliance advice.