追跡対象7施設の合計排出量は年間約5,583,338 t-CO₂です。排出上位施設、現在の参考価格に基づくCO₂価値、部門の削減経路を示します。
| 指標 | 価値 | 注記 |
|---|---|---|
| 追跡対象施設 | 7 | CO₂推計あり |
| 推計CO₂合計 | 5,583,338 t/yr | Climate TRACE 2023 |
| 施設当たり平均 | 797,620 t/yr | |
| 総額(全量価格) | €421M/yr | 追跡対象CO₂全量 × €75.36/t CBAM ref — 無償割当とEU向け輸出割合を考慮する前 |
このハブでは当該国の炭素価格制度を追跡していません。CBAM対象品をEUへ輸出する場合、国内炭素価格の控除なしで国境炭素価格が適用されます。
| # | 施設 | Owner | t CO2/年(2023年推計) | 指標的な価値 |
|---|---|---|---|---|
| 1 | Atocongo Cement Plant | Unacem Perú SA | 1,823,284 | €137.4M |
| 2 | Yura Cement Plant | Yura SA | 1,163,130 | €87.7M |
| 3 | Pacasamayo Cement Plant | Cementos Pacasmayo SAA | 1,079,719 | €81.4M |
| 4 | Condorocha Cement Plant | Unacem Perú SA | 746,867 | €56.3M |
| 5 | Piura Cement Plant | Cementos Pacasmayo SAA | 527,792 | €39.8M |
| 6 | Rioja Cement Plant | Cementos Pacasmayo SAA | 143,940 | €10.8M |
| 7 | Cajamarquilla Cement Plant | Caliza Cementos Inca SA | 98,606 | €7.4M |
Climate TRACEの衛星推計( IndustryAtlas — モデル推計であり検証済み申告値ではありません。一部は施設群を集約しています。根拠のある訂正を受け付けます。
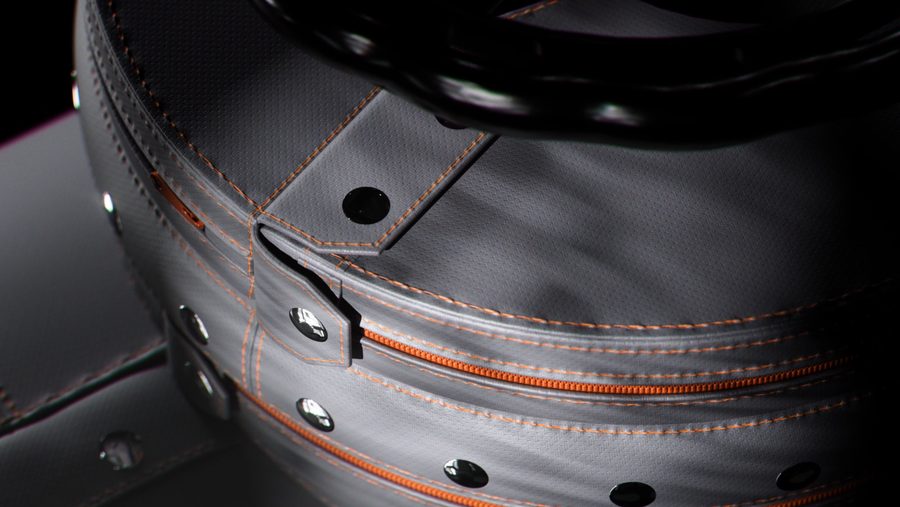
ボイラー、キルン、熱交換器、バルブ、蒸気ラインは継続的にエネルギーを失います。Inzonexは次を作ります: Inzonex Modular Insulation — snap-fastened modules engineered per temperature tier, not generic off-the-shelf jackets:
Every tonne you stop emitting is a tonne you don't have to report: cutting heat loss is a measurable, auditable Scope 1 reduction that flows straight into EU ETS, CBAM and your ESG / CSRD disclosures — not an offset, an actual emission cut.
