
Data-centre electricity: 2026 evidence
How much electricity do data centres use? The answer depends on the year, geography and model. Here are ten traceable figures, with estimates, projections and metered statistics kept separate.
Global
Separate report editions. Historical estimates are not a new metered time series; the two 2030 values are projections, not two observations of growth.
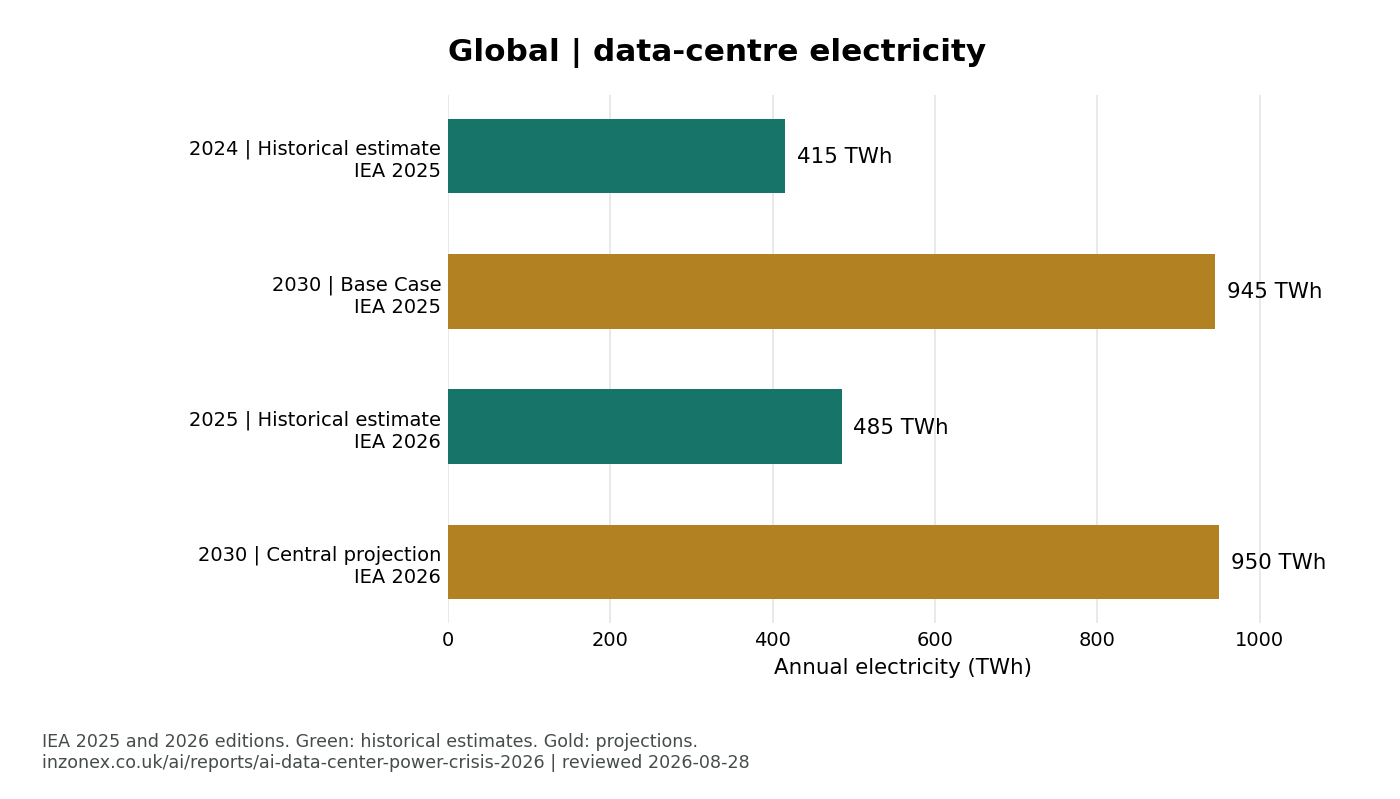
| Year | Basis | TWh | Status | Source edition |
|---|---|---|---|---|
| 2024 | Historical estimate | 415 | Estimate | IEA 2025-04-10 |
| 2030 | Base Case | 945 | Projection | IEA 2025-04-10 |
| 2025 | Historical estimate | 485 | Estimate | IEA 2026-04-16 |
| 2030 | Central projection | 950 | Projection | IEA 2026-04-16 |
United States
One model family, one target year. Low and high are Compounded Uncertainty scenarios, not a statistical confidence interval. The Reference Case is not a guaranteed outcome.
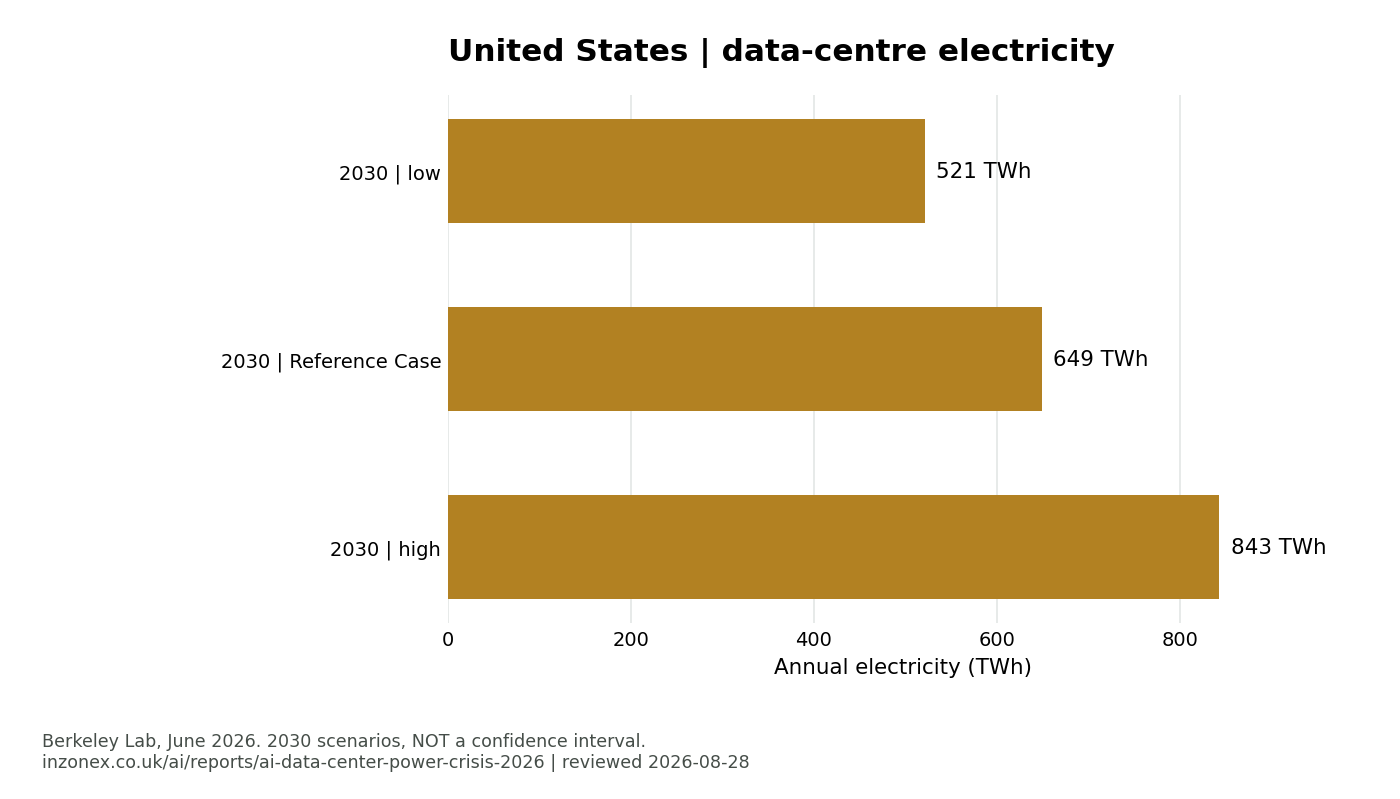
| Year | Basis | TWh | Status | Source edition |
|---|---|---|---|---|
| 2030 | Compounded Uncertainty: low | 521 | Projection | Lawrence Berkeley National Laboratory 2026-06 |
| 2030 | Reference Case | 649 | Projection | Lawrence Berkeley National Laboratory 2026-06 |
| 2030 | Compounded Uncertainty: high | 843 | Projection | Lawrence Berkeley National Laboratory 2026-06 |
Ireland
Selected annual totals from the July 2026 release. These cover mains electricity meters identified as data centres, not an AI-only or all-energy footprint. The 2024 total is revised.
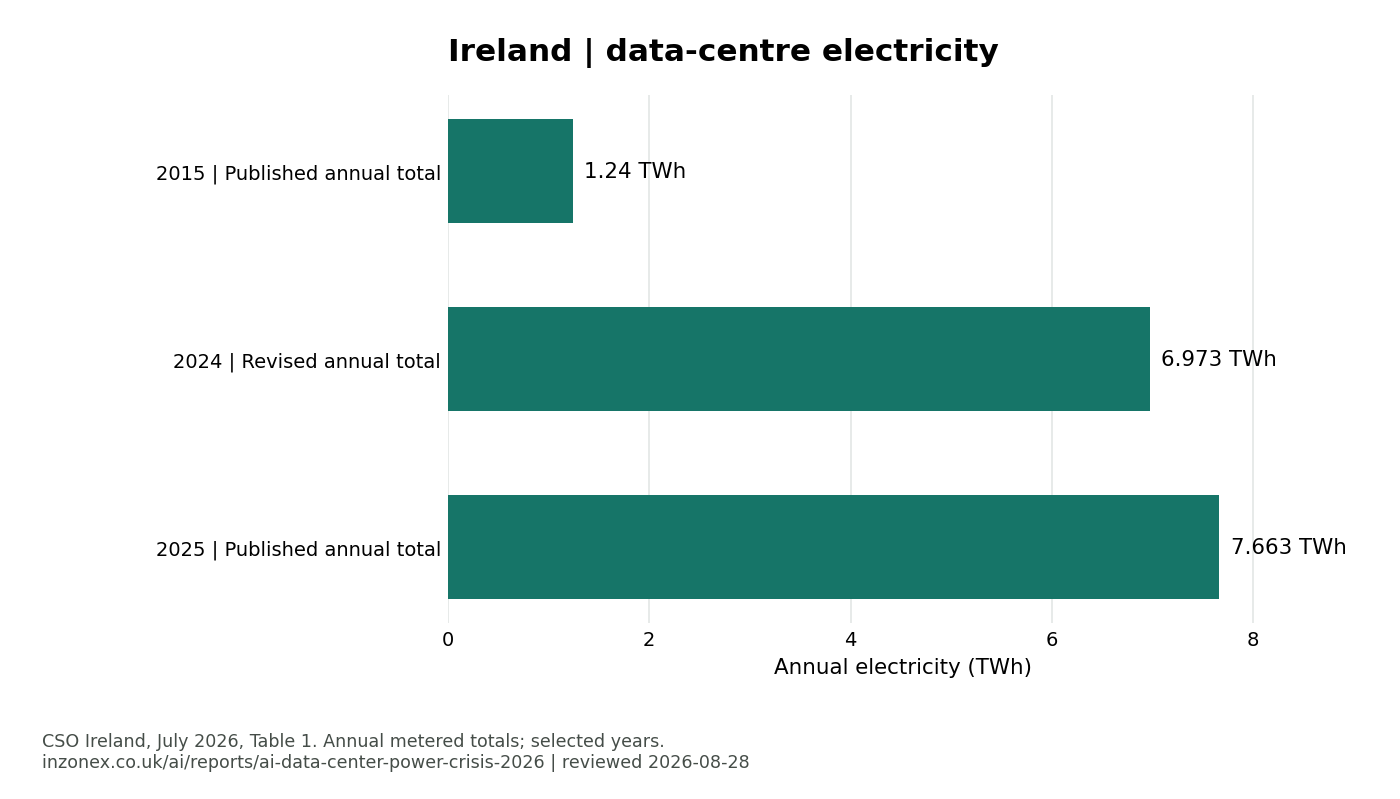
| Year | Basis | TWh | Status | Source edition |
|---|---|---|---|---|
| 2015 | Published annual total | 1.24 | Metered | Central Statistics Office, Ireland 2026-07-07 |
| 2024 | Revised annual total | 6.973 | Metered | Central Statistics Office, Ireland 2026-07-07 |
| 2025 | Published annual total | 7.663 | Metered | Central Statistics Office, Ireland 2026-07-07 |
What changes when the editions are separated?
The global 2030 projection moves from 945 TWh in the IEA 2025 edition to 950 TWh in its 2026 edition: a 5 TWh revision, or about 0.53%. That is a comparison of two forecasts for the same year, not annual electricity growth. IEA 2025; IEA 2026.
Within the CSO July 2026 release, Ireland's annual metered total increases from 6.973 to 7.663 TWh between 2024 and 2025: about 9.9%, using the published rounded totals. This is a historical change within one statistical release, not a forecast revision. CSO Table 1.
The US Reference Case is 649 TWh for 2030; its 521-843 TWh bounds span alternative combined assumptions. Do not add that US figure to the global total or divide it by IEA's projection to manufacture a country share. Berkeley Lab 2025 Update, published June 2026.
What an industrial energy buyer can take from this
A national electricity forecast is not a site's connection offer, tariff or peak-load study. Before using a headline number in an investment case, ask for the relevant network area, committed rather than announced load, timing, and who bears connection costs. Treat those as missing inputs, not values supplied by this dataset.
For an AI procurement decision, separate the workload question from the grid question. A model comparison needs the same task and an observed result; electricity per answer needs an explicit measurement boundary. This report provides neither vendor scores nor per-query energy estimates. The workflow match and datasheet evaluation packet cover task design separately.
Methodology and limits
- Record the source edition and the year the number describes. These are separate fields in both downloads.
- Retain the source unit and divide GWh by 1,000 for TWh. A common unit does not remove differences in coverage.
- Keep all-data-centre figures separate from AI-specific claims. No all-data-centre total here is relabelled as AI electricity.
- Use published annual CSO totals. Summing independently rounded quarters can differ by 1 GWh. The CSO's historical series can be revised.
- Keep model scenarios separate from measurements. No probability weights, global ranking, extrapolation or new demand forecast are supplied.
This is a dated editorial snapshot, not a daily feed. The figures were checked on 28 August 2026; later releases may revise them. Reuse the source links and edition dates with each chart or row. Inzonex normalization and charts are not endorsed by the source institutions.
Questions about the figures
Is 950 TWh the electricity used by AI alone?
No. The IEA 2026 projection covers all data centres, including non-AI workloads. It is a 2030 projection, not measured consumption in 2026.
Why do some reports say 945 TWh and others 950 TWh?
The 945 TWh projection comes from IEA's April 2025 report. The April 2026 update gives 950 TWh for 2030. Preserve the report edition when quoting either number.
Can the US estimate be divided by the global estimate?
Not as a defensible country share. The Berkeley Lab and IEA projections come from different model families and assumptions. Common units do not make their boundaries or scenarios interchangeable.
Is the US scenario range a probability of demand?
No. Berkeley Lab's 521-843 TWh bounds combine alternative assumptions and uncertainties. They are not a confidence interval or a probability that a particular outcome will occur.
How is Ireland's electricity total converted?
Divide the published annual GWh total by 1,000. The 2025 value of 7,663 GWh becomes 7.663 TWh. Use the annual total, not a sum of independently rounded quarterly values.
Sources and reuse
- IEA: Energy and AI (2025-04-10). Executive summary: 2024 consumption and 2030 Base Case. Source methodology / report. Report: CC BY 4.0; selected published headline figures, not the separately licensed data product.
- IEA: Key Questions on Energy and AI (2026-04-16). Executive summary: updated data-centre electricity demand outlook. Source methodology / report. Report: CC BY 4.0; selected published headline figures, not the separately licensed data product.
- Lawrence Berkeley National Laboratory: United States Data Center Energy Usage Report: 2025 Update (2026-06). Publication abstract: Reference Case and Compounded Uncertainty scenarios. Publication month is the precision supplied by the record. Source methodology / report. Selected factual headline estimates with attribution; no redistribution of the report or its underlying model.
- Central Statistics Office, Ireland: Data Centres Metered Electricity Consumption 2025 (2026-07-07). Table 1, annual Data Centre column. Publication year confirmed by the statistician's comment and PxStat update timestamp; the page's release-header year is inconsistent. Source methodology / report. CSO statistics, CC BY 4.0; annual totals reproduced with attribution and converted from GWh to TWh.
Suggested citation: Inzonex (2026), Data-centre electricity: 2026 evidence, evidence snapshot 2026-08-28. Underlying figures: IEA (2025, 2026), Berkeley Lab (2026), CSO Ireland (2026). Inzonex original charts and compilation: CC BY 4.0; source rights remain as identified above.