6 gevolgde installaties stoten samen circa 3,288,905 t CO₂/jaar uit. Hier staan de grootste uitstoters, de indicatieve CO₂-waarde en het reductiepad voor de sector.
| Metriek | Waarde | Opmerking |
|---|---|---|
| Gevolgde installaties | 6 | met CO₂-schattingen |
| Totaal geschatte CO₂ | 3,288,905 t/yr | Climate TRACE 2023 |
| Gemiddelde per installatie | 548,151 t/yr | |
| Brutowaarde (volledige prijs) | €263M/yr | alle gevolgde CO₂ × €80.01/t EUA — vóór gratis toewijzing en aandeel van EU-export |
Voor dit land wordt op deze hub geen koolstofprijsinstrument gevolgd. Exporteurs van CBAM-goederen naar de EU betalen nog steeds de grensprijs, zonder aftrek van een binnenlandse koolstofprijs.
| # | Installatie | Owner | t CO2/jaar (geschat 2023) | Indicatieve waarde |
|---|---|---|---|---|
| 1 | Tunisia_Pelagian_Conventional shelf | — | 1,435,942 | €114.9M |
| 2 | Tunisia_Illizi - Ghadames_Conventional onshore | — | 980,308 | €78.4M |
| 3 | Tunisia_Pelagian_Acid/sour gas | — | 391,028 | €31.3M |
| 4 | Tunisia_Sahara_Conventional onshore | — | 315,438 | €25.2M |
| 5 | Tunisia_Pelagian_Conventional onshore | — | 162,377 | €13.0M |
| 6 | Tunisia_Atlas_Conventional onshore | — | 3,812 | €0.3M |
Satellietschattingen van Climate TRACE via IndustryAtlas — gemodelleerd, niet geverifieerd; sommige vermeldingen bundelen installatieclusters. Correcties met bewijs zijn welkom.
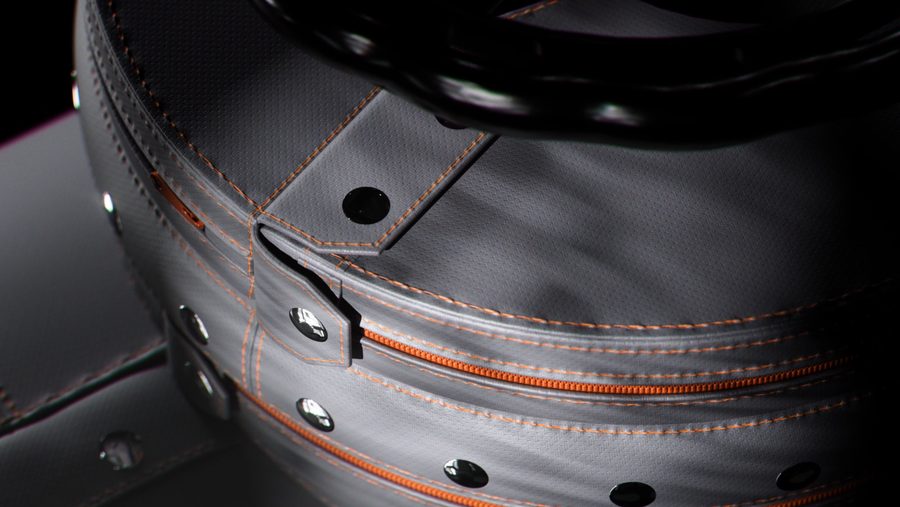
Ketels, ovens, warmtewisselaars, afsluiters en stoomleidingen verliezen continu energie. Inzonex maakt Inzonex Modular Insulation — snap-fastened modules engineered per temperature tier, not generic off-the-shelf jackets:
Every tonne you stop emitting is a tonne you don't have to report: cutting heat loss is a measurable, auditable Scope 1 reduction that flows straight into EU ETS, CBAM and your ESG / CSRD disclosures — not an offset, an actual emission cut.
